Google Analytics 4 (GA4): Ultimate Guide and Tutorial How to Use it

Rieta
By -
0
Google Analytics tools can help you increase website potential very well and easily! In this guide, you will learn how to use Google Analytics from preparation to creating reports to improve digital performance.

Google Analytics is a free tool that you can use to give you an overview of the website statistics that you manage. And Google Analytics has become the key to success in understanding website visitor behavior and optimizing business visibility digitally.

In this guide, we will explain step by step how to easily and effectively master Google Analytics. What will you get from this article?

  • You will learn how to set up Google Analytics.
  • The basics of how to use Google Analytics.
  • How to make a report in Google Analytics.

How do I set up Google Analytics account?


Before you start using Google Analytics, there are some preparations that need to be made. First of all, make sure you have a registered Google account with a valid email address and password. Once a Google account has been successfully created, remember that it is not direct access to Google Analytics. Because you need to sign up for the Analytics service and in the next section, we'll cover how to do that in detail..

However, there is one important thing to note when setting up Google Analytics and that is to make sure you are using a valid Google account. Only with a valid Google account, you can access this tool. Now, let's continue by learning the steps you need to take to set up Google Analytics.

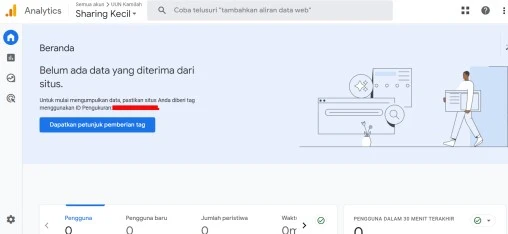
  • Step 1: Visit the Google Analytics website and sign in with an existing Google account. If you haven't signed up for Google Analytics before, follow the signup steps shown during the signup process. After registering, you will be directed to the Analytics Dashboard as shown below:


  • Step 2: On the Analytics Dashboard, click on the “Admin” button at the bottom left.
  • Step 3: On the next page, under the “Create New Property” section.

  • Step 4: Fill in your website property details, including name, business details, business purpose, choose a platform and enter the appropriate website URL.

Before we continue the discussion, pay attention to the important notes below:

Note: GA4 is different from Universal Analytics, where Universal Analytics uses View, while GA4 uses Data Stream/Data Stream. But both have a similar function.

  • Step 5: We continue. If you are currently still using Universal Analytics, open the account and property you want to add the view to. Use the menu provided and find the “Create View” option. Here, provide a name for your view and choose the type of view, whether it's for a website or an app. Also answer some other questions that may arise. It's important to note that you can add up to 25 views to a property in Google Analytics. As for those who are already using GA4, the process is slightly different. Go to the account and property where you want to add the Data Stream. Use the menu provided and find the option for Add Data Stream. Here, you can select or add the data streams that you want to include in the property. After that, don't forget to save the changes you've made.
  • Step 6: When creating the property, you will have access to a tracking ID code and this code you will need to add to every page on your website. And all you need to do is paste the tracking code right after the <head> tag on every website page. Detailed discussion of how to implement the tracking code from Google Analytics on the website, we have discussed in the discussion of the guide to installing Google Analytics on the website.
  • Step 7: Next you just need to visit the GA portal to verify and make sure the code is working. The way you can do this is by looking at the Real-Time Report section.

Open your website, if the Real Time Report section displays at least one website visitor, then the configuration you did is correct.


Is Google Analytics 4 better than Universal Analytics?


Even though at the time of writing this article (in June 2023), Universal Analytics can still be used, but we recommend that you migrate to Google Analytics 4.

Because we got the latest update from Google, which Google announced starting July 1, 2023, only the Google Analytics 4 (GA 4) version will be available for access to the analytics dashboard. This means that the previous version, Universal Analytics (UA), will no longer work.

If you are learning Google Analytics at the moment, it is recommended to install the GA 4 version right away to ensure that you are learning and mastering a platform that is more up-to-date and conforms to the latest standards. However, if you previously had an account in the Universal version, then it's time to upgrade to GA 4.

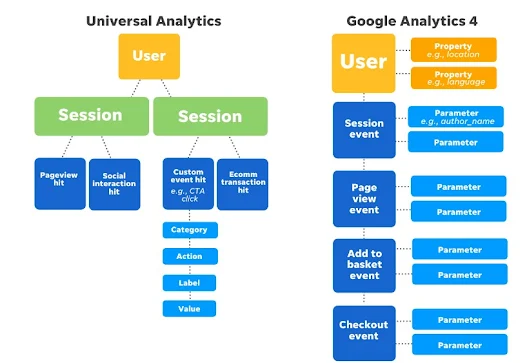
Below are the basics of Google Analytics 4 and the hierarchy you need to know once you migrate from Universal Analytics to Google Analytics 4.

What is the hierarchy of a Google Analytics 4 account?


Google Analytics has many sections and it is important that you clearly understand and learn about them.

Like the Google Ads, Meta Ads and TikTok Ads dashboards, the Google Analytics 4 (GA4) account also has a hierarchical structure that helps analyze data efficiently. Let's explore the hierarchical structure of Account(s), Properties, and Data Streams in GA4.

1. Account(s)


At the top level, GA4 uses the concept of Account(s) which represent corporate or brand entities that manage their digital assets, such as websites and applications. By using Account(s), you can centrally organize and manage your digital assets.

2. Properties


Every digital asset, be it a website or an application, is represented by a Property in GA4. In one account, you can own multiple properties. This property represents the relevant data set for a single userbase. So, if a company has both a website and an app, data from both will be analyzed in one Property.

3. Data Streams


Data Stream is an integral part of the Property. If you want to view or analyze data from a website or application separately, you need to view it through the appropriate Data Stream.

Google Analytics 4 offers several Data Stream options, such as streams for websites, mobile (Android & iOS). Each Data Stream provides deeper insight into how users interact with websites or applications through various channels.

By using Data Streams, you can get valuable information, such as how effective certain marketing channels are in reaching users, the user's journey within the website or application, and how users move between channels. This allows you to optimize your marketing strategy and user experience more effectively.

How does GA4 tracking work?


There are some basics of how to use Google Analytics 4 that you need to master, if you have previously operated Universal Analytics. We guarantee, the basics in this article can be understood very well.

1. Track Automatically Collected Event Data


Google Analytics 4 collects some event data automatically when you set up tags on your site. For example, when using Google Tag Manager's preview mode, whenever a tag fires it will be sent automatically as an event.

2. Automatic Tracking of Multiple User Interactions in Google Analytics 4


In this case, Google Analytics 4 (GA4) provides enhanced measurement as a default when creating data streams. This allows GA4 to automatically track various user interactions, such as page views, scrolls, outbound links, video engagement, and downloads. Let's explore in more detail about these events:

Page_view

GA4 automatically collects these events when pages are loaded or browser history changes. Using the Views metric, page_location, and page_referrer dimensions, you can track the user interactions that occur on the page.

Scroll

Event data will be sent when a visitor scrolls at least 90% of a site page for the first time. To track this event, you can check the scroll percentage dimension.

Click

This event is sent whenever a visitor clicks on a link that points to another domain. In addition to the event data, you will also get parameters such as link_classes, link_domain, link_id, link_url and outbound.

View_search_results

GA4 gets this data when parameters such as search, query, and keywords appear in the page URL when a visitor performs a site search. This information can be found in the Search terms dimension.

Video_start, video_progress, video_complete

These events are sent when the embedded video starts playing, lasts from 10% to 75% of the total duration time, and finishes.

 File_download

GA4 collects data about any files downloaded by visitors, including text, executable, audio, video, presentation, or compressed files.


In order to use it properly, you can first activate the setting. How "Admin -> Property -> Data Stream" and click the toggle that appears. In this setting, GA4 automatically collects data related to these events.

If you want to disable tracking of some events in enhanced measurement, you can adjust the settings by clicking on the settings icon and adjust according to your needs.

By leveraging enhanced measurement in Google Analytics 4, you can automatically collect data that provides more detailed insights into user interactions on your platform. This will help you effectively optimize your strategy and user experience.

3. Custom Events


Google Analytics 4 (GA4) provides a Custom Event feature that allows users to track and measure events that do not fall into the default event categories provided by GA4. With Custom Events, users can collect data about specific actions or interactions that are relevant to their business goals.

How to use Custom Events in Google Analytics 4 (GA4), are as follows:

  • Step 1: Create a custom event name corresponding to the action or interaction you want to track. For example, “button_click” to track clicks on a specific button.
  • Step 2: Define additional parameters relevant to the event. Parameters are additional information that you want to include along with the event name. For example, if you wanted to track clicks on a “Buy Now” button, you could include parameters such as “button_id” or “product_id”.
  • Step 3: Implement the appropriate GA4 tracking code into your website or app. There are two common ways to do this: Add the GA4 tracking code to your web page. You can find the GA4 tracking code in the GA4 user interface or through the Google Analytics documentation. You can also use Google Tag Manager, create a custom tag in Google Tag Manager with the appropriate settings to send Custom Events to GA4.
  • Step 4: Inside the tracking code or custom tag, apply the event name you specified as the “event_name” parameter. And, add relevant additional parameters if needed.
  • Step 5: Save changes and apply the GTAG tracker or update the configuration in Google Tag Manager.
  • Step 6: After the Custom Event is implemented, the event data will be sent to GA4. To view and analyze Custom Event data, you can use the reports and measurement tools provided by GA4. These reports can usually be found in the “Events” or “Events” section of the GA4 user interface.

What are standard reports in Google Analytics 4?


Reports in Google Analytics 4


Google Analytics 4 (GA4) has brought a number of new features that allow users to gain richer and deeper insights into how their website is performing. With various types of customized reports, users can easily track and analyze relevant data to achieve their business goals. Let's take a look at some interesting reports on the GA4 account.

1. Home Contains Information Center Presenting Report Snippet


The Home page in GA4 provides a snippet report that summarizes a website's performance over a certain period of time. Users can view summaries of various reports and easily explore more details by clicking on the appropriate “View report” button. The Home page also adjusts its appearance based on user behavior, making it easier for them to find the data source they need.

2. Realtime Report Used for Report Tracking the Latest Data


Would you like to see what's happening to your website right now? Use Realtime reports. This report displays the most recent data, providing an overview of user activity in the last 30 minutes or so.

3. You can also use the Acquisition Report to report Traffic Sources


The Acquisition report helps you understand which channels your traffic is coming from. With this report, you can see the number of visitors and find out which channel sources brought them to your website successfully.

4. You Can Use Engagement Reports for User Interaction Reports


If you want to see the number of events that have occurred and the types of events that are most frequently performed by users, the Engagement report is the answer. This report provides comprehensive data about the Events, Conversions, Page & Screen and Landing Pages present on your website.

5. Demographic Report Can Be Used to Report Visitor Demographic Data


The Demographics report helps you understand the demographic data of your website visitors. You can see in detail which city or country they come from, the age range of the most visitors, the majority gender, and what special interests or interests they have.

6. Tech Report Used to Understand Visitor Tools


If you want to learn what devices your website visitors use, the Tech report is a useful reference. This report shows the platform, operating system, device category, browser, and screen size used by visitors when accessing your website.

Using these reports, you can dig deeper insights into user behavior, optimize marketing strategies and improve your website performance.


Conclusion


Understanding the behavior of website visitors and optimizing marketing strategies is very important. In this guide, we have comprehensively explained how to use Google Analytics, a powerful analytics platform, to track and analyze your website data. From initial setup to relevant reports, you'll have a solid understanding of how to make effective use of Google Analytics 4.
Tags:

Post a Comment

0Comments

Post a Comment (0)

#buttons=(Ok, Go it!) #days=(20)

Our website uses cookies to enhance your experience. Learn more
Ok, Go it!